
The Overview dashboard
Overview is the page you land on. It answers one question - can I run something right now, and is anything of mine running? - and nothing else.
The three cards
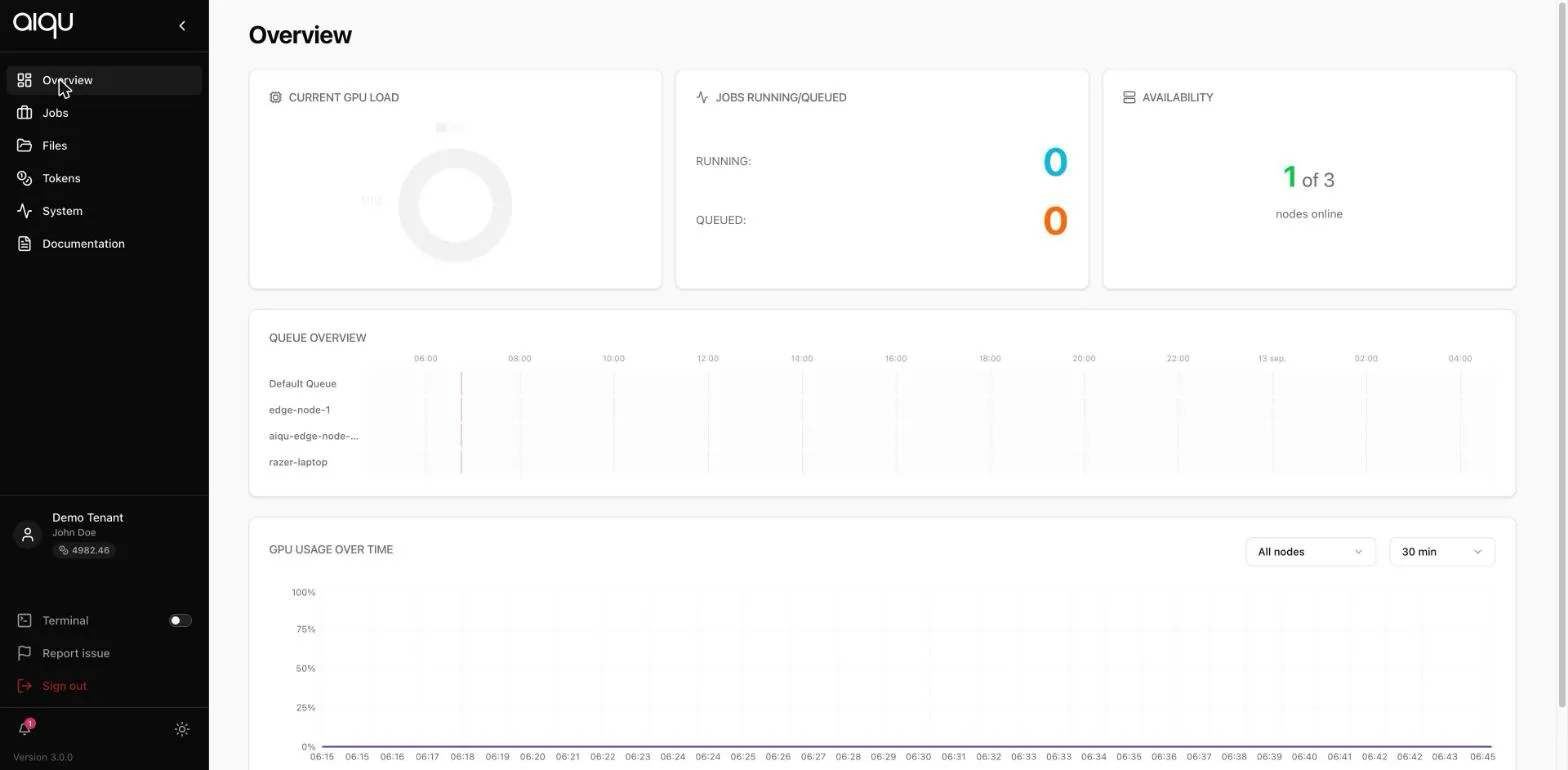
Section titled “The three cards”Current GPU load is the share of GPU capacity in use across the nodes you can reach, right now. Idle means nobody is competing with you.
Jobs running / queued counts your jobs, not the tenant’s. Queued above zero means something of yours is waiting for capacity.
Availability is the one to read first: nodes online out of nodes that
exist. 1 of 3 means two machines in your tenant are switched off, unreachable
or disabled. If a queue you expected to use is empty, this is usually why.
Queue overview
Section titled “Queue overview”A timeline per queue, showing when it had work on it. Use it to see whether a queue is genuinely busy or merely unavailable - a queue with no bookings and no online node looks the same as an idle one until you check Availability.
GPU usage over time
Section titled “GPU usage over time”Utilisation across the selected nodes over the selected window. All nodes and 30 min are the defaults; both are selectors.
This chart is about the shared resource, not your job. For your own job’s consumption, open the job and use the Metrics view in its detail panel.